POC Lines (Daily / Weekly / Monthly)This indicator plots the Point of Control (POC) on your chart for three key timeframes — daily, weekly, and monthly. The POC is the price level at which the highest trading volume occurred during a given period, highlighting where market participants were most active.
How to Trade Using the Daily / Weekly / Monthly POC Indicator
Identify Market Bias
Use the monthly POC as a major structural reference. If price is above the monthly POC, bias may be bullish; below it may signal caution or potential bearish bias.
Use the weekly POC for intermediate trend context. Price respecting the weekly POC can enhance confidence in direction.
Use the daily POC for fine-tuning entries, exits or intraday structure.
Use POC as Support/Resistance Zones
When price approaches a POC from above, the level can act as support — look for bullish reversal signals.
When price approaches a POC from below, it can act as resistance — look for bearish rejection setups.
If price breaks through a POC convincingly (with strong volume or momentum), then the level may flip: the broken POC becomes a new reference zone for opposite side trades.
Timeframe Confluence = Higher Probability
A trade setup is stronger when the daily, weekly, and monthly POCs align or cluster near the same price zone. This confluence raises the chance that price will react.
Conversely, avoid setups where the POCs are widely scattered across timeframes — these have less structural weight.
Entry, Stop & Target Strategy
Entry: Enter once price touches a significant POC level and shows confirmation (e.g., candlestick reversal, volume spike, or confluence with other level).
Stop-Loss: Place stop just beyond the POC level (for support trades, slightly below; for resistance trades, slightly above).
Target: Use the next major POC or price structure level (previous high/low, value area edges) as your initial target. If price moves through the POC, target a breakout to the next structural zone.
Be patient — price may test a POC level multiple times or ignore it entirely before reacting.
Use the POC indicator as a guiding framework, not a guarantee. Combine with other tools (trend direction, price action, volume, market context) to refine your execution.
在脚本中搜索"point of control"

Smart Liquidity 📊 # 💎 Smart Liquidity Indicator - User Guide
## 📋 Overview
**Smart Liquidity Indicator** is an advanced technical analysis tool for analyzing liquidity and volume in financial markets. It combines several powerful analytical tools to help you make informed trading decisions.
---
## 🎯 Main Components
### 1. 📊 Volume Profile
- **Function**: Displays volume distribution across different price levels
- **Benefit**: Identify strong support and resistance zones based on trading activity
- **Elements**:
- Colored boxes representing volume density at each level
- Labels showing HIGH/LOW of the price range
- PEAK FLOW line indicating the strongest volume level
### 2. 📦 Order Blocks
- **Function**: Identify bullish and bearish Order Block zones
- **Benefit**: Potential areas for price reversal or trend continuation
- **Displayed Information**:
- Delta %: Zone strength (difference between buying and selling pressure)
- Liquidity: Accumulated liquidity in the zone
- Buy/Sell ratios within the zone
### 3. 📈 SuperTrend (Market Direction)
- **Two lines for confirmation**:
- **🎯 Current SuperTrend** (Green/Red): Current timeframe direction
- **🔄 MTF SuperTrend** (Light Green/Red): Higher timeframe direction (4H default)
- **Benefit**: Trade with the overall market trend
### 4. 📊 Dashboard (Information Panel)
- Display current market status
- Trend and momentum information
- Active Order Blocks statistics
---
## 🚀 How to Use
### 1️⃣ **Reading Volume Profile**
- **Dense boxes** = High volume accumulation areas = Strong support/resistance
- **PEAK FLOW line** = Strongest price level (POC - Point of Control)
- **HIGH/LOW Labels** = Boundaries of the analyzed price range
### 2️⃣ **Analyzing Order Blocks**
- **Positive Delta (+)** = Strong buying pressure → Reliable bullish zone
- **Negative Delta (-)** = Strong selling pressure → Reliable bearish zone
- **Delta near 0** = Balance → Weak zone, avoid it
### 3️⃣ **Using SuperTrend**
- **Current TF (Green bullish / Red bearish)**: Current timeframe direction
- **MTF (Light Green bullish / Light Red bearish)**: Higher timeframe direction
- **Best Trading**: When both lines agree on the same direction
### 4️⃣ **Suggested Strategy**
```
✅ Strong Entry Signal:
1. Order Block with strong Delta (>30% or <-30%)
2. Current SuperTrend and MTF in the same direction
3. Volume Profile confirms the level (dense box or PEAK)
4. Price tests the zone for the first time
❌ Avoid Entry When:
- Weak Delta (between -10% and +10%)
- Conflict between Current and MTF SuperTrend
- Zone tested multiple times (weakened)
```
---
## 🎨 Understanding Colors
### Order Blocks
- 🟢 **Green**: Bullish Order Block
- 🔴 **Red**: Bearish Order Block
### SuperTrend
- 🟢 **Green**: Current SuperTrend bullish (same color as Order Blocks)
- 🔴 **Red**: Current SuperTrend bearish (same color as Order Blocks)
- 🟢 **Light Green**: MTF SuperTrend bullish
- 🔴 **Light Red**: MTF SuperTrend bearish
**Note**: Each SuperTrend has different transparency levels based on trend strength
### Volume Profile
- **Gradient from light to dark**: Represents volume density (darker = higher volume)
---
## ⚡ Performance Tips
### For Maximum Speed (Current Settings):
✅ **Enabled**:
- Order Blocks: 2 zones per side
- Volume Profile: 20 levels
- SuperTrends: Both active
- Strength Delta: Displayed
❌ **Disabled** (for speed):
- Gradient Fill
- Predictive Zones
- Background Fill
- MTF Calculations (in internal calculations)
### If Indicator is Slow:
1. Reduce `Profile Rows` from 20 → 15
2. Reduce `Lookback Period` from 50 → 40
3. Reduce `Max Zones` from 2 → 1
4. Turn off `Show OB Labels` if not needed
---
## 🔄 Additional Tools
### ♻️ Reset Now
- **Location**: Visual Tweaks
- **Usage**: If Volume Profile is cluttered, enable it to redraw
- **Note**: Disable after use
### 🎯 Draw Mode
- **Live**: Direct drawing on the last candle
- **Confirmed**: Draw only on closed candles (more stable)
---
## ⚠️ Disclaimer
### 🚨 Important Notice
**This indicator is a technical analysis tool only and is not considered financial advice or a trading recommendation.**
#### 📌 Please Note:
1. **Just an Analytical Tool**:
- The indicator provides technical information based on historical data
- Past results do not guarantee future results
2. **Personal Responsibility**:
- You are solely responsible for your own trading decisions
- Conduct your own research before making any investment decision
- Use appropriate risk management (Stop Loss, Position Sizing)
3. **No Guarantees**:
- There is no guarantee of profit or success in trading
- Financial markets carry high risks
- You may lose your entire invested capital
4. **Consult a Professional**:
- Consult a licensed financial advisor before making important investment decisions
- Ensure you fully understand the risks associated with trading
5. **Proper Use**:
- The indicator is designed as an assistive tool, not an automated trading system
- Preferably combine it with your own analysis and other tools
- Do not rely on a single signal alone
#### ⚖️ Acceptance:
By using this indicator, you acknowledge and agree that:
- The indicator developer is not responsible for any financial losses
- All trading decisions are your personal responsibility
- You understand the risks associated with trading in financial markets
---
## 💡 Final Advice
**"The best traders use tools wisely, not blindly"**
- Learn how the indicator works before relying on it
- Test settings on a demo account first
- Always use Stop Loss
- Don't risk more than you can afford to lose
---
## 📞 Contact and Support
**If you need any help or have any questions, feel free to contact me.**
I'm here to help you understand and use the indicator correctly! 🤝
---
**Good Luck & Trade Safe! 🚀📈**

PheeTrades - Value Area Levels (VAH / VAL / POC Visualizer)This script helps traders quickly visualize key Volume Profile–style levels such as Value Area High (VAH), Value Area Low (VAL), and Point of Control (POC) using recent price and volume data.
While TradingView’s built-in Volume Profile tool is great for manual analysis, this indicator automatically calculates and plots approximate value zones directly on your chart — ideal for traders who want to identify high-probability support and resistance areas without drawing a fixed range every time.
Features:
Calculates short-term VAH, VAL, and POC based on a user-defined lookback period.
Plots color-coded levels for quick visual reference.
Helps identify “fair value” zones where most trading activity occurred.
Useful for detecting breakout or mean-reversion opportunities around value extremes.
How to use:
Apply the script to any chart and set your preferred lookback period.
VAH (red line): potential upper resistance or overbought zone.
VAL (green line): potential lower support or accumulation zone.
POC (orange line): price level with the highest traded activity — often a magnet for price.
Note:
This is a simplified Value Area model meant for educational and analytical use. It does not replace TradingView’s official Volume Profile or broker-level volume distribution data.

Previous Day Volume Profile NQ!This indicator takes the previous U.S. regular trading session and maps its most actively traded price zone onto the next day. It draws a shaded box representing the Value Area (≈68% of prior-day volume), bounded by VAH (Value Area High) and VAL (Value Area Low). A line through the middle marks the POC (Point of Control), the single price with the most traded volume. The box projects 15.5 hours into the new day so you can see where today’s action sits relative to yesterday’s “fair value.”
To help with intraday decisions, the indicator also extends VAH/VAL/POC as dotted lines. These extensions act like “guide rails” for context into the next trading session.
How to read it
Inside the box: Market is back in yesterday’s fair value. Expect mean-reversion behavior, with price often rotating between VAL and VAH.
Re-entry signals: When price comes from outside and establishes back inside, the script can flag a Long Re-entry (from below, bias toward VAH) or Short Re-entry (from above, bias toward VAL). Optional target lines show the opposite edge as a practical objective.
Rejection signals: When price tests a boundary (VAH/VAL) and fails to establish inside, it can reject and push away—often a clue for potential price discovery beyond the box.
POC focus: The POC often behaves like a magnet during balance and a pivot during imbalance; the dotted extension keeps it visible even after the box window.
Use case
Ideal for day traders and short-term swing traders who want a clear, repeatable framework.
Quickly judge whether today is balancing (staying within yesterday’s value) or seeking new value (rejecting and exploring).
Pair the signals with your execution rules (e.g., 5-minute closes, buffers, or confirmation candles).
Everything is configurable—colors, opacities, and whether to show extensions or target lines—so you can tailor the visuals to your style without clutter.

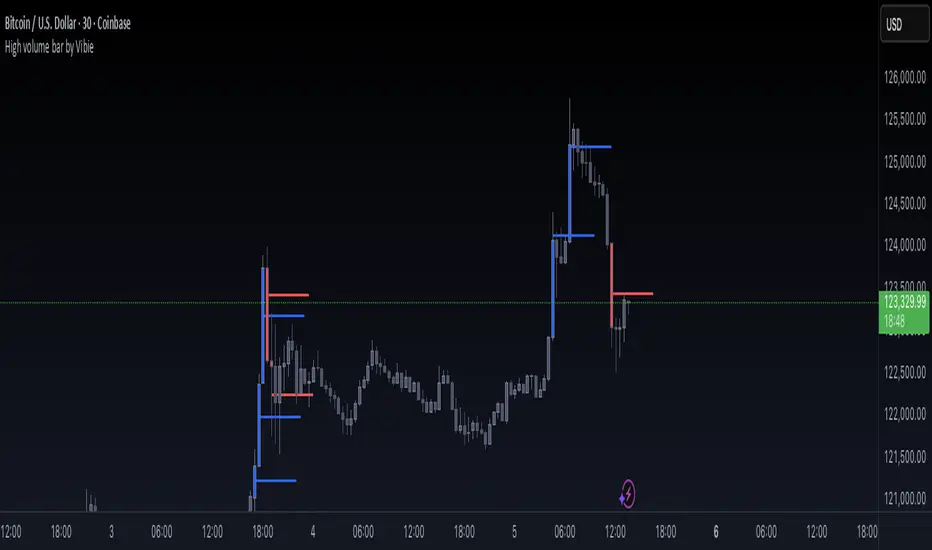
High volume bar by VibieHigh Volume Bar with Extended vPOC (Aggregation Enabled)
🧠 Concept
This indicator is designed to detect institutional activity and large traders by using statistical volume analysis and identifying key intrabar liquidity levels.
It applies Z-Score volume analysis to highlight unusually high volume candles and marks the Volume Point of Control (vPOC) inside each detected bar — the price level where the most volume was transacted.
⸻
⚙️ How It Works
1. Z-Score Volume Analysis
• The indicator calculates how far current volume deviates from its historical average using standard deviations (Z-Score).
• When the Z-Score exceeds the user-defined threshold, the candle is flagged as a High Volume Bar (HVB).
2. Multi-Exchange Aggregation
• Volumes from Binance, Bybit, and Coinbase can be aggregated into a composite volume metric.
• This provides a broader and more accurate market perspective, minimizing anomalies from individual exchanges.
3. Candle Coloring
• Bullish HVB → entire candle (body + wicks) is colored blue.
• Bearish HVB → entire candle is colored red.
• This makes large volume events immediately visible on the chart.
4. vPOC Detection
• The script examines a lower timeframe (e.g., 1 minute) within the HVB to find the price level with the highest traded volume.
• A horizontal line is drawn at that price and can be extended for multiple bars, marking a short-term liquidity zone that often acts as support or resistance.
⸻
🧭 How to Use
• vPOC levels frequently act as liquidity magnets and are often retested after the HVB appears.
• Bullish HVB + vPOC below current price = potential long entry zone.
• Bearish HVB + vPOC above price = potential short entry zone.
• Useful for identifying institutional absorption, stop runs, or hidden accumulation/distribution.
⸻
🌟 Why It’s Original and Useful
• Combines statistical volume analysis (Z-Score) with intrabar volume profiling.
• Aggregates multiple exchanges for broader accuracy.
• Offers precise liquidity levels that classic indicators don’t provide.
• Especially valuable for advanced traders looking for institutional footprints.
Smooth Cloud + ZigZag VPOC CORE v6📌 Description
The Smooth Cloud + ZigZag VPOC indicator is designed to help traders visualize market structure and potential confluence zones.
Smooth Cloud: Built from smoothed moving averages (EMA, RMA, or HMA), this cloud highlights the underlying short-term trend by shading bullish and bearish phases.
Pivots (ZigZag style): Marks confirmed swing highs and lows, helping to identify support/resistance and breakout areas without repainting.
VPOC (Volume Point of Control): Plots the price level with the highest traded volume, either from a rolling lookback or anchored to a custom date. This often acts as a magnet or reaction level.
ATR Bands: Optional dynamic bands based on volatility to frame potential extension zones.
Signals & Alerts: Generates long/short labels when price breaks pivot levels in line with trend filters, with optional confluence from HTF trend, VPOC, and ATR.
This tool combines trend context, structure, and volume confluence in a single view to support decision-making.
✅ Notes
This script is intended for technical analysis and educational use only.
It does not provide financial advice or guaranteed outcomes.
Signals are purely analytical and should be combined with independent risk management.

Phantom Trend IndicatorOverview
The Phantom Trend Indicator (PTI) is a streamlined tool for identifying trend direction and strength. It blends zigzag-based trend detection with a volume profile to display a histogram showing price distance from the Point of Control (POC). Six distinct colors highlight trend states, with background highlights for extreme price zones. Ideal for stocks, forex, crypto, and futures across any timeframe.
Features:
Trend Detection: Uses zigzag fractals to identify uptrends and downtrends.
Histogram Colors: Six colors for trend strength (low, high, extreme for up/down trends) or neutral (gray).
Dynamic Levels: Plots POC, Value Area Low (VAL), and High (VAH) via volume profile.
Background Colors: Highlights overbought (above VAH) or oversold (below VAL) zones.
Alerts: Signals new trends.
How It Works:
Trends: Zigzag fractals define trend ranges, with price position setting histogram colors (low, high, or extreme).
Histogram: Shows price deviation from POC.
Background: Colors extreme zones outside VAL/VAH.
This indicator builds on traditional trend detectors and volume profiles by integrating them into a single, cohesive tool. Unlike standard momentum indicators that rely on moving averages, PTI uses zigzag fractals for more responsive trend identification, reducing lag in volatile markets. Compared to basic volume profile scripts, it adds trend-based color coding and background alerts for extremes, providing clearer visual cues for overbought/oversold conditions. The six distinct colors indicate trend strength, and customizable thresholds allow fine-tuning for different assets and timeframes, enhancing adaptability. Traders benefit from combined momentum and liquidity insights, helping spot reversals or continuations more reliably—making PTI a valuable, standalone addition for both novice and experienced users.
Settings
Trend Detector: Toggle alerts, adjust zigzag sensitivity, and set thresholds for low-to-high and extreme color transitions.
Dynamic Levels: Configure volume profile period, multiplier, accuracy, value area percent, and ATR-based channel width.
Visuals: Customize POC, VAL, VAH, and area fill colors.
Read Histogram: Uptrend colors show early, strong, or overextended moves; downtrend colors indicate early, weakening, or oversold conditions; gray for consolidation.
Background: Monitor for overbought/oversold color-coded signals.
Tune: Adjust zigzag or period settings for your timeframe/asset.
Tips
Shorten period for intraday, extend for swing trading.
Pair with other indicators for confirmation.
Notes:
Requires sufficient chart data for volume profile.
Test settings for low-volatility assets.
For informational use only, not financial advice. Test thoroughly, and happy trading!

Weekly Volume Profile -Previous Week Projected into Current WeekThis indicator displays the Volume Profile of the previous week projected into the current week. It calculates the Point of Control (POC), Value Area High (VAH), and Value Area Low (VAL) based on the weekly volume distribution. Lines are extended to the right to provide a reference for the current week's trading. Optional small labels show PWPOC, PWVAH, and PWVAL. Ideal for traders who want to track key levels from the previous week and use them as support/resistance in the current week.
Features:
Customizable number of price bins
Adjustable Value Area percentage
POC, VAH, and VAL lines projected forward
Optional minimal labels for each level
Resets every week on Sunday 22:00 UTC

Simple TPODisplays price distribution over time using Time Price Opportunities (TPO). Shows Point of Control (POC), Value Area High/Low (VAH/VAL) levels to identify key support/resistance zones and fair value areas. Includes customizable timeframes and price breakout alerts.

Prev Day Volume ProfileWhat the script does
Calculates yesterday’s Volume Profile from the bars on your chart (not tick data) and derives:
POC (Point of Control)
VAL (Value Area Low)
VAH (Value Area High)
Draws three horizontal lines for today:
POC in orange
VAL and VAH in purple
Adds labels on the right edge that show the level name and the exact price (e.g., POC 1.2345).
Why it’s bar-based (not tick-based)
Pine Script can’t fetch external tick/aggTrades data. The script approximates a volume profile by distributing each bar’s volume across the price bins that the bar’s high–low range covers. For “yesterday”, this produces a stable, TV-native approximation that’s usually sufficient for intraday trading.
Key inputs
Value Area %: Defaults to 0.70 (70%)—the typical value area range.
TZ Offset vs Exchange (hours): Shifts the day boundary to match your desired session (e.g., Europe/Berlin: +1 winter / +2 summer). This ensures “yesterday” means 00:00–24:00 in your target timezone.
Row Size: Manual? / Manual Row Size: If enabled, you can set the price bin size yourself. Otherwise, the script chooses a TV-like step from syminfo.mintick.
Colors & Line width: POC orange; VAL/VAH purple; configurable width.

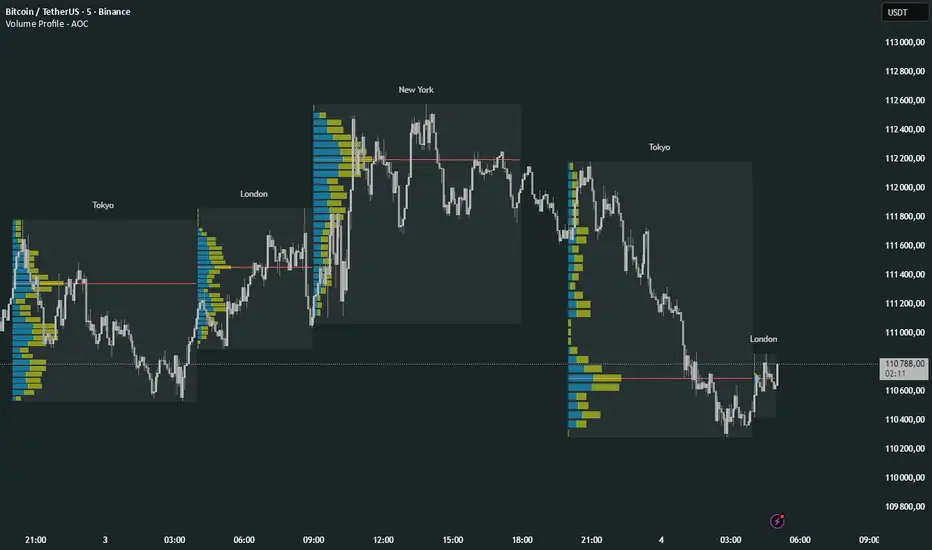
Volume Profile Multi periodVolume Profile - AOC 📈
Unlock market insights with this powerful volume profile indicator! Analyze trading activity across multiple sessions with customizable settings and clear visuals. Perfect for traders aiming to identify key price levels and market trends with precision. 🚀
Key Features:
Multi-Session Support: Visualize volume profiles for Tokyo, London, New York, Daily, Weekly, Monthly, Quarterly, and Semiannual sessions. 🌍
Customizable Display: Choose session types, resolution, and bar modes (Mode 1 or Mode 2) to match your strategy. 🎛️
Point of Control (POC): Highlights the most traded price levels for each session. 🎯
Color-Coded Profiles: Distinct up/down volume visualization for quick analysis. 📊
Session Labels: Optional labels for easy identification of session periods. 🏷️
High/Low Tracking: Tracks session-specific highs and lows for accurate profiling. 📏
Empower your trading decisions with clear, actionable volume data! 💡
HTF POC with Zones & AlertsPlots a Point of Control (POC) per candle from a timeframe you choose (MTF). Because TradingView doesn’t expose true footprint data, the POC here is a proxy (choose: Body Mid, Range Mid, or Typical Price HLC3). The script draws the POC line and an optional POC zone (±% of that candle’s range), then alerts when price retests the zone (wick touches count).
Use it to:
Mark key levels inside candles that often act as magnets or reaction zones
Track retests of strong bars (imbalance) across higher timeframes
Add clean confluence with S/R, FVGs, or trend tools
Features: Selectable TF, zone width, extend lines/zones, historical caps, alerts, and info panel.
Note: This is an estimate of POC from OHLC, not real bid/ask volume. Use as context, not a standalone signal.

Cnagda Trading ToolCnagda Trading Tools - complete set of intraday trading
1. Trendline breakout based On ATR.
2. Live RSI, volume/candle average 20 Periods, trend direction last 34 periods, and some useful dashboard features.
3. Ma Scalp Line provide trend support and resistance + Where Line More Flat Previous Time You Also Use That Range As Support And Resistance
4. RSI based POC ( Point Of Control) indicate high Volume Area like fixed Range Volume profile
5. London session breakout with buy/sell Signal and NewYork session opening half hour range breakout with Buy/sell signal
Ma Scalp Buy And Sell Signal For Short term Scalping ( 5 Min Timeframe) Based on Ema And Wma Crossover
I hope these tools will improve your trading, but you should trade only after proper research, this indicator is not responsible for any loss.

Daily Signal Alert**📄 English Description (English version)**
**Indicator Name:** Daily Signal Alert + Multi-Indicator Dashboard & Volume Profile
This all-in-one indicator combines multiple technical analysis tools into a single dashboard to help you read market movements easily and make better trading decisions.
It provides technical signals, key support/resistance levels, and a basic volume profile, along with a smart alert system.
**Included Indicators:**
1. **Exponential Moving Averages (EMA 9/20/50):**
* Shows current trend by comparing EMA9 & EMA20 with EMA50.
* Generates bullish and bearish crossover signals.
2. **MACD (12/26/9):**
* Generates bullish and bearish crossovers between MACD line and Signal line.
3. **Relative Strength Index (RSI 14):**
* Detects overbought (RSI > 70) and oversold (RSI < 30) conditions.
4. **Average Directional Index (ADX 14):**
* Measures trend strength and indicates if the trend is bullish or bearish.
5. **Candle Behavior (Squeeze):**
* Compares the current candle size with the previous one to detect momentum squeeze/expansion.
6. **Relative Volume (RVOL):**
* Shows if current volume is above or below average.
7. **Traditional Pivot Levels (Daily / Weekly / Monthly / Auto):**
* Displays key support and resistance levels.
8. **Approximate Volume Profile (POC / VAH / VAL):**
* Identifies Point of Control (POC) and Value Area range.
**Features:**
* Option to display all signals or only the latest one (removing old ones).
* Dashboard table summarizing indicator states with automatic coloring.
* Automatic alerts when any signal appears.
* Auto mode for pivot timeframe selection.
* Basic volume profile to highlight accumulation/distribution zones.
**How to Use:**
* Enable or disable “Show All Signals” depending on your trading style.
* Monitor the dashboard to quickly check indicator states.
* Use Pivot Levels & Volume Profile for key market zones.
* Enable alerts to get notified immediately after a candle closes.
**📄 Arabic Description (الوصف العربي)**
**اسم المؤشر:** Daily Signal Alert + Multi-Indicator Dashboard & Volume Profile
هذا المؤشر المتكامل يجمع بين عدة أدوات تحليل فني في لوحة واحدة، ليساعدك على قراءة حركة السوق بسهولة واتخاذ قرارات تداول أفضل.
المؤشر يعرض إشارات فنية، مستويات دعم ومقاومة، وجانب من تحليل حجم التداول، بالإضافة إلى نظام تنبيه ذكي.
**المؤشرات المدمجة:**
1. **المتوسطات المتحركة الأسية (EMA 9/20/50):**
* يعرض الاتجاه الحالي عبر مقارنة EMA9 و EMA20 مع EMA50.
* إشارات تقاطع صاعدة وهابطة.
2. **مؤشر الماكد (MACD 12/26/9):**
* يعطي إشارات تقاطع صاعدة وهابطة بين خط الماكد وخط الإشارة.
3. **مؤشر القوة النسبية (RSI 14):**
* يحدد حالات التشبع الشرائي (RSI > 70) والتشبع البيعي (RSI < 30).
4. **مؤشر الاتجاه المتوسط (ADX 14):**
* يقيس قوة الاتجاه مع تحديد إذا كان صاعداً أو هابطاً.
5. **سلوك الشموع (Squeeze):**
* يقارن حجم الشمعة الحالية مع السابقة لتحديد ضغط أو انفراج الحركة.
6. **حجم التداول النسبي (RVOL):**
* يحدد إذا كان حجم التداول أعلى أو أقل من المتوسط.
7. **مستويات Pivot التقليدية (Daily / Weekly / Monthly / Auto):**
* تعرض نقاط الدعم والمقاومة الرئيسية.
8. **بروفايل الحجم التقريبي (POC / VAH / VAL):**
* يحدد نقطة التحكم (POC) ومنطقة القيمة.
**المزايا:**
* عرض جميع الإشارات أو آخر إشارة فقط (مع حذف الإشارات القديمة).
* جدول ملخص لحالة كل مؤشر مع تلوين تلقائي.
* تنبيهات تلقائية عند ظهور أي إشارة فنية.
* دعم الوضع التلقائي لاختيار إطار مستويات الـ Pivot.
* عرض بروفايل حجم تداول تقريبي لمناطق التجميع/التوزيع.
**طريقة الاستخدام:**
* فعّل أو عطّل عرض جميع الإشارات حسب أسلوبك.
* راقب الجدول لمعرفة حالة المؤشرات لحظياً.
* استخدم مستويات الـ Pivot والبروفايل لتحديد مناطق الدعم والمقاومة.
* فعّل التنبيهات لتصلك الإشارات فور إغلاق الشمعة.

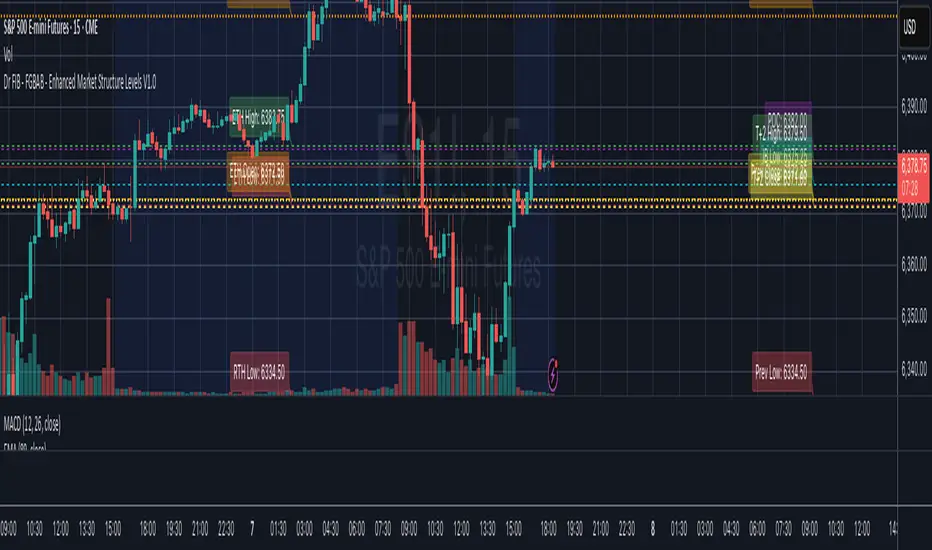
Dr FIB - FGBAB - Enhanced Market Structure Levels V1.0Based on Market Profile Auction Theory this indicator will provide you will key levels that will help you tailor your trading and structure the market movements properly.
This indicator will provide the following information on the chart in any time frame you select and for any instrument including Futures, Stocks and Crypto.
The levels will be provided as fully configurable horizontal lines including the following data:
- Regular trading hours HIGH, LOW and OPEN.
- Extended Trading Hours HIGH, LOW, OPEN.
- Previous Day HIGH, LOW, CLOSE.
- T+2 Settlement HIGH, LOW and CLOSE.
- Point of Control (POC).
- Initial Balance HIGH and LOW. (1st hour RTH Open).
As price tend to re-visit well know price areas, you will find this indicator very useful for day to day trading.
Volume Profile + VWAP + Long Wick StrategyVolume Profile + VWAP + Long Wick Strategy
This indicator combines Volume Profile (VP), VWAP (Volume Weighted Average Price) with deviation bands, and a long wick candle strategy to identify potential support/resistance zones and trading signals. It detects "power wicks" (long shadows with high volume near key levels like POC, VAH/VAL, or VWAP) as reversal setups, generating buy/sell alerts after confirmation wicks appear near these zones.
Key Features:
Volume Profile: Displays VP histogram over a lookback period, highlighting POC (Point of Control), VAH/VAL (Value Area High/Low) with customizable rows and thresholds.
VWAP & Bands: Plots VWAP with 1-3 std dev bands; filters signals based on trend and proximity to bands.
Long Wick Detection: Identifies strong ("power") and signal wicks based on wick/body ratios, ATR size, and volume multipliers. Supports Market Maker (MM) volume bonuses for liquidity zones.
Trading Signals: Generates BUY/SELL arrows when price retests wick levels with confirmation, limited by max signals per zone and min wait bars. Filtered by MTF (multi-timeframe) alignment (e.g., higher TF EMA trend and candle direction) and VWAP trend.
Sessions: Shows POC/VAH/VAL for Asian, London, and NY sessions with optional active-only display.
MTF Analysis: Scores bullish/bearish alignment across two higher timeframes for signal filtering.
Visuals: Liquidity sweep boxes, resistance/support lines, info table (levels, signals remaining, VWAP status), and MTF status box.
Customizable: Adjust wick ratios, volume thresholds, VP rows, MTF periods, and display options.
Ideal for intraday/scalping on forex/crypto/stocks. Use on lower TFs with MTF filters for confluence. Not financial advice—backtest thoroughly!

Ema With VoLume RangeEMA with Volume Range – Adaptive Trend, Trailing Stops & Volume Profile Zones
This sophisticated indicator integrates three powerful trading tools in a single overlay: a classic EMA200, precision ATR-based buy/sell signals, and a unique double-zone volume profile for deep market structure analysis. Ideal for swing traders, scalpers, and volume-driven investors seeking actionable, multi-dimensional price insights.
Core Features
EMA200 (Exponential Moving Average):
Plots a customizable EMA200 (blue line) for identifying primary trend direction and dynamic support/resistance.
Exponential smoothing is enabled by default for better tracking of recent price action.
ATR-Based Trailing Stop with Buy/Sell Signals:
Uses Average True Range (ATR) to set adaptive trailing stop levels that respond to current market volatility.
Buy and Sell signals (tiny green and red labels) trigger whenever price crosses the trailing stop for precise entries and exits.
All signals are alert-enabled for automated or semi-automated trading workflows.
Adjustable ATR multiplier and lookback for tuning responsiveness.
Dual Volume Range Zones & Profile Histogram:
Automatically highlights recent high/low price zones (upper and lower) using your lookback period and zone width settings.
Each zone is split into horizontal "bins," color-coded for buy/sell dominance and highlighting the Point of Control (POC)—the price with the most traded volume.
The indicator draws live volume histograms inside each zone, supplementing them with labels that show buy vs. sell volumes and POC statistics.
Adjustable bin count, transparency, colors, and histogram granularity to fit your visual preference.
Optional midlines and fair value drift line help visualize price equilibrium and value shifts over time.
How to Use
Trend Confirmation: Align trades with the EMA200—trade long above, short below, or wait for ATR-trailing stop triggers that coincide with the EMA bias.
Signal Generation: Use the ATR trailing stop Buy/Sell signals to spot shifts in volatility-adjusted direction early.
Volume Zone Analysis: Identify where the highest concentration of buy/sell activity occurred within the customizable upper/lower zones:
Use high volume bins and POC as magnets for price, support/resistance, or to confirm breakout/failure zones.
Leverage the fair value drift line and dynamic labels to detect changes in market sentiment and volume pressure.

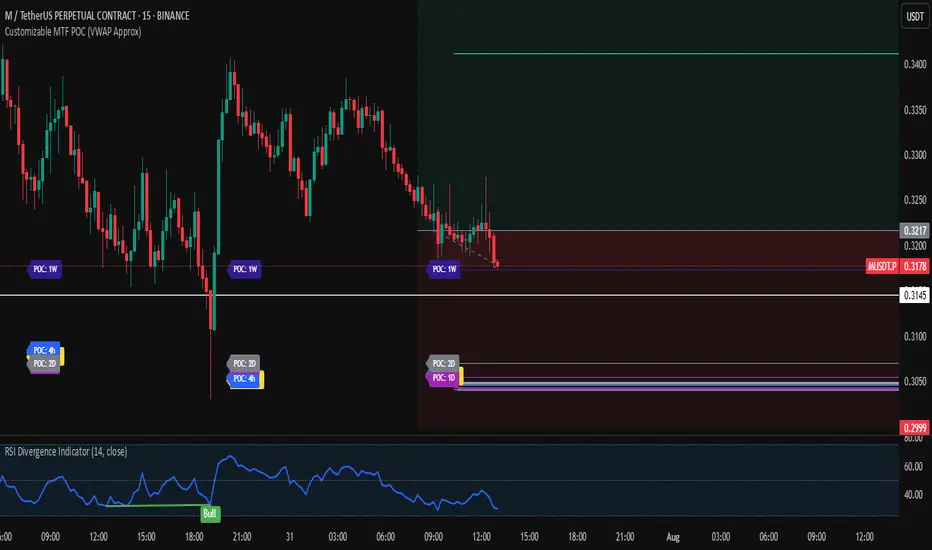
Customizable MTF POC (VWAP Approx)🔍 Multi-Timeframe VWAP POC Zones
This script displays volume-weighted average price (VWAP) levels from multiple timeframes on a single chart. Each VWAP level acts as a potential dynamic support or resistance zone, depending on the price action.
✅ Customizable timeframes included:
1m, 5m, 15m, 1h, 2h, 4h, 1D, 2D, 1W, 1M
📌 Key Features:
– VWAP lines per timeframe with adjustable visibility
– Color-coded for clarity
– Useful for identifying high-confluence support/resistance zones
📈 Usage Tip:
Combine this indicator with price action or liquidity zones for more accurate entries. Confluent VWAP zones across multiple timeframes often signal strong reaction areas.
⚠️ Note: This script uses VWAP as an approximation for Point of Control (POC). It does not rely on true volume profile histograms due to Pine Script limitations. For full volume profile analysis, use TradingView’s built-in “Fixed Range Volume Profile” tool.
Smart Money Volume Execution Footprint @MaxMaserati 2.0 Smart Money Volume Execution Footprint @MaxMaserati 2.0
Volume and Price Execution Tracker · Volume Delta · VWAP · POC · DOM Simulation
Overview
This volume and price tool high grade tool reveals **where** smart money is actually executing within each candle — not just how much volume traded, but the **exact price levels** where large buy/sell orders hit the tape.
By simulating Depth of Market (DOM) logic, it breaks each candle into price levels (default: 8–20) and reconstructs intra-candle volume pressure to identify:
• Institutional execution zones
• Buy vs Sell dominance
• Volume-weighted positioning
• Smart money flow bias (bullish / bearish / neutral)
Think of it as a powerful X-ray footprint to spot real-time volume/price behavior.
Core Features
Execution Dots (Smart Money Signatures)
• Plots dots at key institutional execution prices
• Color-coded: 🟢 Green = dominant buy volume · 🔴 Red = dominant sell volume
• Dot size = Volume Intensity (relative to average):
– tiny < 1.0x avg
– small 1.0x–1.5x
– normal 1.5x–2.5x
– large 2.5x–4.0x
– huge > 4.0x (massive positioning)
Volume Modes (Buy/Sell Breakdown)
• Total Volume Mode: Combined buy + sell volume at each price level
• Volume Delta Mode: Net buy/sell pressure (buy − sell)
Dot Placement Modes
• Volume POC: Dot at level with highest volume (Point of Control)
• VWAP: Dot at intra-candle volume-weighted average price
• Highest Volume Level: Similar to POC, simplified for fast bias detection
Smart Money Bias Detection
Real-time consensus calculation based on buy/sell volume ratio:
🟢 Bullish Consensus (>60% Buy Volume): Smart money buying → Long bias
🔴 Bearish Consensus (<40% Buy Volume): Smart money selling → Short bias
⚪ Neutral Market (40–60%): Market in balance → Wait for breakout
This logic powers the volume execution table, showing institutional sentiment per candle.
Dot Placement Example (How It Works)
Let’s say you break a candle into 10 price levels:
• Volume POC Mode → Dot at \$4,297.50, where volume was highest
• VWAP Mode → Dot around \$4,275, the volume-weighted average
• Volume Delta Mode → Dot where net buying/selling pressure peaked
Dot sizes based on volume intensity:
Level 1 (400K): size.huge — heavy institutional execution
Level 10 (300K): size.normal — passive accumulation
Level 5 (250K): size.normal — potential battle zone
🔗 Optional Visual Enhancements
• Zigzag Lines: Connects execution dots to highlight flow direction
• Labels: Toggle to show volume and/or execution price directly on dots
• Execution Table: Real-time snapshot of volume ratio, delta, and institutional bias
Option to see the volume and/or exact Price level
Ideal Use Cases
Institutional Flow Strategy
1. Look for large dots (size.large or size.huge)
2. Confirm direction with bias table (bullish or bearish consensus)
3. Align entries with institutional execution zones
4. Use retests of large dot prices as entries or exits
Option to only see huge buying and selling area to solely focus on them for retest
Volume Divergence Signals
• Price making new highs, but dot size shrinking → Weak breakout
• Price making new lows, but weak dot volume → Potential bounce
• Huge dot + rejection wick → Institutional defense zone
Configurable Settings
• Dot Placement: VWAP · POC · Delta
• Volume Mode: Total vs Delta
• Price Granularity: 5 to 50 levels per candle
• Dot Labels: Volume / Price
• Table Size, Position, and Color Themes
Important Notes
• Best used on high-volume markets (futures, indices, major FX pairs)
• Ideal timeframe: 1m–15m for precision, 1h–4h for position setups
• Integrates well with VWAP, session levels, or structure-based trading

MojoPivots Breakout Signals [DonnieMojo]The MojoPivots Breakout Indicator is a precision-engineered tool designed for traders seeking high-probability breakout opportunities using dynamic pivot structures and real-time volume imbalances.
Built on DonnieMojo’s breakout framework, this indicator analyzes market structure via custom MR (Major Resistance) and MS (Major Support) levels, dynamically derived from intraday volume profiles and statistical price expansion. It intelligently tracks and visualizes potential breakout zones, key "line-in-the-sand" levels, and take-profit targets (TP1, TP2, TP3) based on volatility-adjusted zones.
🔑 Core Features:
Breakout Signal Detection
Identifies potential bullish and bearish breakouts when price breaches predefined resistance (MR1) or support (MS1) levels with confirmation from volume dynamics.
Smart Take-Profit System
Targets are automatically mapped to MR2–MR4 and MS2–MS4, offering structured TP zones based on standard deviation thresholds.
Delta Zone Visuals
Color-coded fills display real-time buyer/seller dominance in each zone using an imbalance-weighted volume model.
VPOC "Sand Line"
The Volume Point of Control is plotted to show the session's key battle line for trend continuation or rejection.
Statistical Performance Panel
Live breakout stats with hit-rate bars (TP1/TP2/TP3) help you evaluate performance and adjust trade management.
🧪 Usage Tips:
Timeframe Sync: The default detection logic is based on 15-minute candles, but pivot zones are calculated from higher timeframes (2H by default). Adjust these in the settings to suit your strategy.
Entry Trigger: Wait for price to close below MS1 or above MR1 and breach it on the next bar to confirm a breakout signal.
TP Scaling: Use TP1 for conservative exits or scale out progressively at TP2 and TP3 for extended moves.
Volume Confirmation: Delta zone fills (green/red) help validate whether breakout levels are supported by buyer/seller strength — fade low-delta signals with caution.
Combine with Trend Filters: Enhance results by using MojoPivots alongside trend indicators like EMAs, ADX, or macro S/R.

HSI Market sessions and Volume profileHSI Market Sessions and Volume Profile
Unlock deeper market insight with this advanced volume profile indicator tailored for Hang Seng Index (HSI) and other futures instruments. This tool combines session-based volume analysis, customizable profiles, and intraday tracking for superior market structure awareness.
🔍 Key Features:
Dynamic Volume Profile: View aggregated buy/sell volume or open interest delta across customizable price zones.
POC, VAH, VAL Lines: Instantly spot the Point of Control, Value Area High, and Value Area Low for each session.
Flexible Session Options: Analyze market behavior by Tokyo, London, New York, or standard timeframes like Daily, Weekly, Monthly, Quarterly, or Yearly.
Live Zone Tracking: Stay ahead with real-time profiling of the current session.
Forex Box Option: Visualize forex trading zones even without volume profiles.
Highly Configurable: Choose from three display modes, resolution settings, and color schemes to fit your style and precision needs.
🧠 Smart Mechanics:
Adaptive to both Volume and Open Interest data.
Built-in smoothing algorithm for cleaner profiles in high-volatility assets.
Auto-reset and draw logic based on session type and bar resolution.
Intrabar data handling for more granular profiling (requires lower timeframe input).
✅ Ideal For:
HSI Futures Traders looking for market session clarity and volume zones.
Volume Profile Analysts needing flexible, session-specific profile rendering.
Day Traders and Swing Traders who value precision in trade planning.

Prev Week POC Buy/Sell Signals
Hi, I’m Edward. I created a straightforward strategy for swing traders (4hr or 8hr timeframe users). This strategy is for traders that are not interested to look at charts all day long, 2 times a day max, but still be profitable.
The indicator:
Print a buy signal when the price closes above the previous week's Point of Control (POC).
Stay in the trade until the price closes below the previous week's POC, then print a sell signal.
The indicator calculates the weekly POC using a basic volume profile method, then tracks the previous week's POC for signals.
Previous week POC is valid from Monday to Thursday. By close of business on Thursday, the current week trend and POC should be well established and should be used make buy or sell decisions. Enjoy!

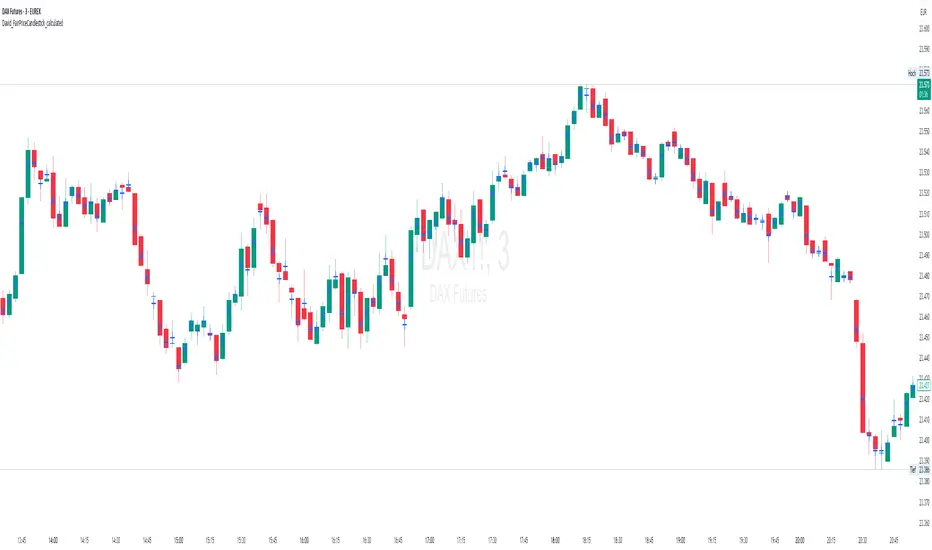
David_FairPriceCandlestick_calculatedDescription:
This indicator displays the "Typical Price" for each candle as a visual marker (cross) directly on the chart. The Typical Price is calculated as the average of the High, Low, and Close values of each bar:
(High + Low + Close) / 3
The marker provides a quick visual reference to the fair or average price level within every single candle.
Unlike a Point of Control (POC) or volume-based indicators, this script works purely with price data and is independent of volume or order flow.
Use cases:
Identify where most trading activity may have been concentrated within the candle (for price-based strategies)
Support as a reference line for mean-reversion or fair value concepts
Works on all timeframes and instruments
Customization:
You can easily change the marker style (cross, dot, triangle, etc.) and color within the script.